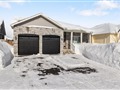
72 Queen St
$1,035,230
Comparative Market Analysis
Jun 14, 2025
NOT AN ACTIVE LISTING
Historical Performance
| Period | $ Change | % Change |
| 1 Day | +$367 | +0.035% |
| 7 Days | +$350 | +0.034% |
| 30 Days | -$1,758 | -0.170% |
| 3 Months | -$4,043 | -0.389% |
| 6 Months | +$13.8k | +1.35% |
| 1 Year | +$332k | +47.3% |
| 3 Years | +$470k | +83.1% |
| 5 Years | +$548k | +112% |
| 10 Years | +$729k | +238% |
List My Property
Real Estate Statistics
Financing Solutions
AS SEEN ON


Are You a Licensed Real Estate Agent or Broker?